
Most lost cybersecurity proposals share one root cause: the buyer never connected the security investment to a business outcome they cared about. Itemized stacks, generic ROI calculators, and threat statistics can all be technically correct, yet they don’t survive contact with a CFO who’s asking what changes for the business once the contract is signed.
The Outcome-First ROI Calculator (available in the Proving Value Kit) was built to win that conversation. It’s an Excel workbook that walks you through a five-step flow that grounds every financial number in something the client told you about their own business. If you’re running an MSP, MSSP, or cybersecurity advisory practice, the calculator slots directly into how you sell, deliver, and renew.
The rest of this post walks through how each step works and how to put the whole thing into your client workflow this quarter.
What’s in the Calculator
The calculator is structured as a five-step conversation flow:
- Value discovery: a discovery script for understanding how the client generates revenue and defines success
- Business context: operational facts and a security maturity baseline, grounded in the discovery answers
- Risk tied to client’s business: seven revenue-impact scenarios with annualized loss expectancy calculations
- Value alignment: a mapping from the client’s desired outcomes to your service capabilities
- Outcome report: a client-facing deliverable that opens with the client’s language and closes with the financial case as supporting evidence
Each step depends on what you captured in the previous one, so by the time you walk into the proposal meeting, every number on the page traces back to something the client said in their own words. The workbook also includes a Start Here tab that summarizes the philosophy and a back-end ROI Summary tab that pulls headline metrics from across the calculator for executive sharing.
Step 1: Value Discovery
The first step is the conversation guide for your first exploratory meeting. The tab is split into four parts that walk through how the client generates revenue, how they define value, how they operate, and a synthesis section for capturing the client’s exact language.
Part A asks how money flows into the business. The questions (“Walk me through your main revenue streams” and “If your systems went down for eight hours on your busiest day, what would that mean?”) anchor downtime risk to a real dollar figure in the client’s terms instead of a generic industry formula. Part B asks how the client defines value. The answer becomes your success metric, quoted verbatim in the final report.
Part C surfaces operational exposure. Part D forces you to synthesize the discovery into the client’s biggest fear, their definition of success, the outcomes they care most about, and the business metric they’ll use to judge whether the engagement was worth it.
Treat this tab as a note-taking sheet you fill in during the conversation. Read the questions aloud and capture what the client says. Don’t paraphrase, and don’t hand the sheet to the client to complete on their own. The discovery is yours to run, and the client’s verbatim answers are the foundation of every later step.
Step 2: Business Context
Step 2 turns the discovery answers into structured data the rest of the calculator can use.
Section 1 captures the company profile (industry, employees, endpoints, revenue model, annual revenue, and current security spend). Section 2 records the revenue risk anchors that make the financial case personal, including estimated revenue per business day, technology dependency, peak revenue periods, largest customer contract value, and the value of contracts that require security compliance.
Section 3 captures operational risk data from the client’s experience. This is where past pain becomes a number on the page. The client’s own incident history is more persuasive than any vendor risk report you can hand them.
Section 4 is a maturity scorecard. You rate eight security domains on a scale from 1 to 5. The scale runs from Initial / Ad-Hoc at 1 to Optimized at 5, with defined criteria at each level. The overall maturity score averages the eight inputs and feeds the ROI Summary tab so the headline number stays current as you refine the assessment.
Every input on this tab should trace back to something the client told you. If you don’t have a figure, leave the cell blank and capture the gap as a follow-up question. Treat industry defaults as a last-resort fallback.
Step 3: Risk Tied to Their Business
Step 3 quantifies risk in seven revenue-impact scenarios mapped to how the client operates. Each scenario has three inputs: annual probability (pre-loaded with industry benchmarks from sources like Verizon DBIR), revenue at risk (the client’s specific exposure based on Step 2), and response and recovery cost.
The seven scenarios include a short contextual paragraph that frames the threat in the client’s specific situation. The phishing-to-breach scenario, for instance, walks through what notification, legal, and forensics costs look like for the client’s revenue model and data inventory.
The total annualized loss expectancy (ALE) sums the seven scenarios into one current-state risk figure. Section 2 then applies an expected risk reduction percentage to produce the annual risk value preserved. The calculator pre-loads 65%, which sits in the middle of the 60% to 75% industry benchmark for managed security engagements. The result is a single dollar figure for the value side of the ROI equation, anchored to scenarios the client recognizes from your discovery conversation.
If you present these numbers, lead with the scenario. Save the probability for when the client asks how you calculated the number. “Based on what you told us about your operations, here’s what a ransomware event would look like for your business” lands harder than a probability percentage opening a conversation.
Step 4: Value Alignment
Step 4 starts with the client’s definition of value and works backwards to your service catalog. Part A is an outcome map: you enter the client’s top three to five desired outcomes (pulled from your Value Discovery notes, using their exact words), then map each outcome to the capabilities in your engagement, the KPIs you’ll measure, the timeline, and how critical the outcome is to the client.
Part B is the investment summary. You list the capabilities in your engagement and the annual investment for each, organized by deployment phase. The capabilities come pre-populated with the most common service categories. Each capability is paired with the outcomes it addresses, so when the client asks what each line item does, the answer is already framed against their stated goals.
Part C is the quantified benefits side of the ledger: annual risk value preserved (pulled from Step 3), downtime prevention value, productivity recovered from freed IT hours, compliance penalty avoidance, cyber insurance premium reduction, and avoided breach costs covering legal, PR, and notification. The total annual value delivered sits next to the total annual investment, and the difference becomes the headline ROI figure.
Lead with Part A in the meeting. Part B is supporting detail to reach for when the client asks for the line items. Part C is financial validation presented after the outcome conversation, as evidence for a decision the buyer has already started to make.
Step 5: Outcome Report
The fifth step produces the client-facing deliverable. The first section, “What You Told Us Matters Most,” opens with three direct quotes from the client’s own words about success, fear, and the one outcome that matters most. The second section, “How This Engagement Delivers What You Defined,” is the outcome map from Step 4, presented as a five-row table mapping the client’s outcomes to your capabilities, measurement KPIs, timelines, and current status.
Only after the outcome conversation does the third section, “The Financial Case,” appear. It shows the current annual cyber risk exposure, the annual risk value the engagement preserves, the annual investment, the net annual benefit, first-year ROI, and the three-year net benefit. These numbers come from the ROI Summary tab, which pulls calculations from across the workbook so the headline figures stay current as you adjust assumptions.
The report closes with proposed next steps: confirming outcome priorities together, locking Phase 1 scope and timeline, scheduling a kickoff, and signing the engagement. Each next step has an owner and a due date because momentum dies in unclear handoffs.
Print the Outcome Report for the proposal meeting. Hand it to the client at the start, walk through their own words first, then move into the engagement plan, and let the financial case validate the decision at the end.
How to Use the Calculator
Here’s the workflow we recommend for your next discovery-to-proposal cycle:
- Before the discovery call, read the Start Here tab and Step 1 (Value Discovery). The questions are designed to be asked in conversation, not handed to the client as a survey.
- During the discovery call, work through the Part A, B, and C questions on Step 1, and capture the client’s exact words in the Part D synthesis. The verbatim answers are the foundation of every later step.
- After the discovery call, fill in Step 2 (Business Context) with the operational facts the client gave you. If a field is blank, mark it as a follow-up.
- Build out Step 3 (Risk) using the client’s revenue and downtime numbers, not industry defaults. Adjust the probability inputs if you have specific intelligence about the client’s threat exposure.
- In Step 4 (Value Alignment), enter their outcomes first, then map your capabilities against the outcomes. Fill in the Part B investment numbers last.
- Generate the Step 5 Outcome Report for the proposal meeting. Print it, hand it to the client, and let it carry the conversation.
For existing clients you’re reviewing or expanding, skip step one and start at Business Context with whatever discovery data you already have, then run the rest of the flow. The calculator works equally well as a renewal tool and a net-new prospecting tool.
Why This Matters Now
Buyers are exhausted from product-led sales motions and quick to drop providers who can’t connect security work to business outcomes in language the board can read.
The calculator offers a structured way to meet those forces head-on. Use Value Discovery to surface the language. Use Business Context and Risk to ground the numbers. Use Value Alignment and the Outcome Report to present a business case the buyer can defend to their CFO. The same workbook serves the proposal moment, the QBR, and the annual renewal conversation, which means your account team learns one workflow and your client sees one consistent story across the lifecycle of the relationship.
How Cynomi Proves Value at Every Stage
The calculator provides the framework for an outcome-first conversation. Building each business case from scratch in Excel can still cost your team hours per client. That’s the work Cynomi automates.
Cynomi is the agentic Security Growth Platform for service providers. The platform connects every security action to a measurable business outcome and generates the artifacts you’d otherwise build by hand, so proving value becomes part of the operating motion instead of a separate exercise.
What changes when Cynomi is in your stack
- Cybersecurity Posture Score with industry benchmarking: Cynomi automatically calculates a quantifiable posture score for each client across all relevant domains, benchmarks the score against target goals, and tracks improvement quarter over quarter.
- Visual dashboard: Dynamic, real-time dashboards visualize security maturity, risk trends, and compliance progress at a glance.
- Executive-level reports and summaries: Cynomi automates non-technical, business-focused reports that summarize performance, highlight achievements, and align security outcomes to business objectives.
- Actionable roadmaps and recommendations: Cynomi generates prioritized, step-by-step action plans tied to business goals, compliance requirements, and risk priorities.
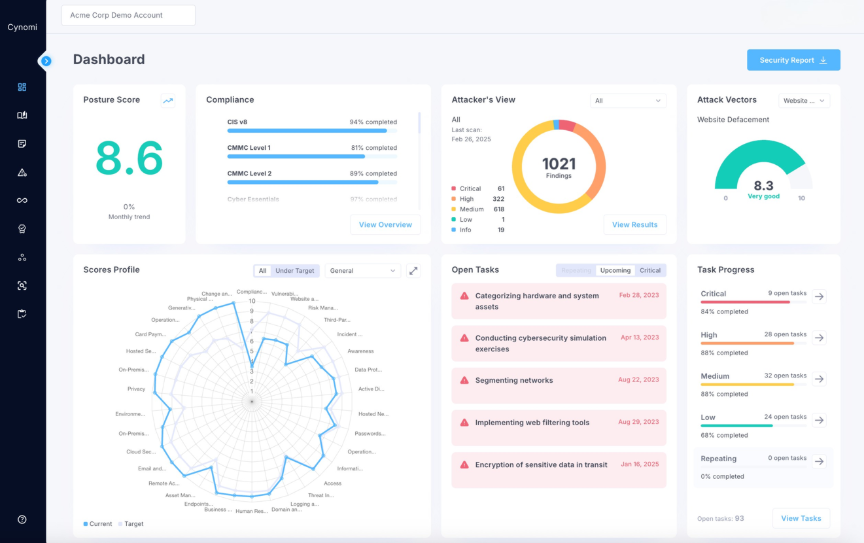
Cynomi dashboard
The calculator is how you start the outcome-first conversation with each client. Cynomi is the operating platform that allows you to deliver on it at scale, with the consistency, automation, and reporting that prove the value of every engagement quarter after quarter.
Table of contents
